Ubuntu 16.04 LAMP server tutorial with Apache 2.4, PHP 7 and MariaDB (instead of MySQL) https://www.howtoforge.com/tutorial/install-apache-with-php-and-mysql-on-ubuntu-16-04-lamp/
Octa-core Cortex-A53 hacker SBC sells for $60
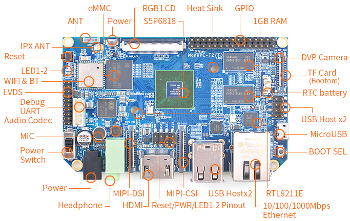
FriendlyARM’s $60, open spec “NanoPC-T3” SBC runs Android or Linux on an octa-core Cortex-A53 SoC packed with wireless and media interfaces, plus 8GB eMMC.
The 100 x 60mm NanoPC-T3 is essentially a NanoPC-T2 with a faster processor and a 2GB RAM option in addition to the standard 1GB. The SBC is further equipped with 8GB of eMMC and an SD slot. You also get GbE, WiFi, Bluetooth 4.0, four USB host ports, and a micro-USB client port. Media ports include HDMI, LVDS, LCD, MIPI-DSI, MIPI-CSI, and audio.
Source: Octa-core Cortex-A53 hacker SBC sells for $60
Some SBC goodness for those processor intense DIY projects out there. Very cool that it’ll run either Android or Linux. FriendlyARM also sells an array of certified externals to help get things up and running. See http://elide.us/9K to order yours.
The Ars guide to building a Linux router from scratch | Ars Technica
The Ars guide to building a Linux router from scratch | Ars Technica http://arstechnica.com/gadgets/2016/04/the-ars-guide-to-building-a-linux-router-from-scratch/
Why Microsoft needed to make Windows run Linux software | Ars Technica
Why Microsoft needed to make Windows run Linux software | Ars Technica http://arstechnica.com/information-technology/2016/04/why-microsoft-needed-to-make-windows-run-linux-software/
After all the hoopla has faded a bit Ars Technica takes an insightful look at the likely reasons that Microsoft made the strategic decision to add Linux support to Windows.
firehol/netdata: Real-time performance monitoring, done right!
firehol/netdata: Real-time performance monitoring, done right! https://github.com/firehol/netdata
Command-line tools for collecting system statistics | Opensource.com
Command-line tools for collecting system statistics | Opensource.com https://opensource.com/business/16/3/system-statistics-sar-and-proc-filesystem?sc_cid=70160000000q67VAAQ
Microsoft ports SQL Server to Linux
The new Microsoft has placed an increased importance on the cloud, and with other companies following suit, reliance on server solutions has increased. Today the company announces that it is bringing SQL Server to Linux.
Both cloud and on-premises versions will be available, and the news has been welcomed by the likes of Red Hat and Canonical. Although the Linux port of SQL Server is not due to make an appearance until the middle of next year, a private preview version is being made available to testers from today.
— Microsoft brings SQL Server to Linux | BetaNews
This is a big deal, even though it isn’t open source. It is Microsoft acknowledging the increasing dominance of Linux in the data center.
Getting started with SaltStack [an alternative to puppet]
Getting started with SaltStack [an alternative to puppet] http://techarena51.com/index.php/getting-started-with-saltstack/
Netflix shows how they get a high level look at Linux in 60 seconds
In 60 seconds you can get a high level idea of system resource usage and running processes by running the following ten commands. Look for errors and saturation metrics, as they are both easy to interpret, and then resource utilization. Saturation is where a resource has more load than it can handle, and can be exposed either as the length of a request queue, or time spent waiting.
uptime
dmesg | tail
vmstat 1
mpstat -P ALL 1
pidstat 1
iostat -xz 1
free -m
sar -n DEV 1
sar -n TCP,ETCP 1
topSome of these
commands
require the sysstat package installed. The metrics these commands expose will help you complete some of the USE Method: a methodology for locating performance bottlenecks. This involves checking utilization, saturation, and error metrics for all resources (CPUs, memory, disks, e.t.c.). Also pay attention to when you have checked and exonerated a resource, as by process of elimination this narrows the targets to study, and directs any follow on investigation.
The Netflix Tech Blog: Linux Performance Analysis in 60,000 Milliseconds http://techblog.netflix.com/2015/11/linux-performance-analysis-in-60s.html
Lots of good info here, though I suspect many sys admins already run through most of this once they land on a box.
Calibrate your Monitor with these Open Source Tools – Linux Links – The Linux Portal Site
Calibrate your Monitor with these Open Source Tools – Linux Links – The Linux Portal Site http://www.linuxlinks.com/article/20151115010546816/MonitorCalibration.html

